Готовая презентация · 6 слайдов

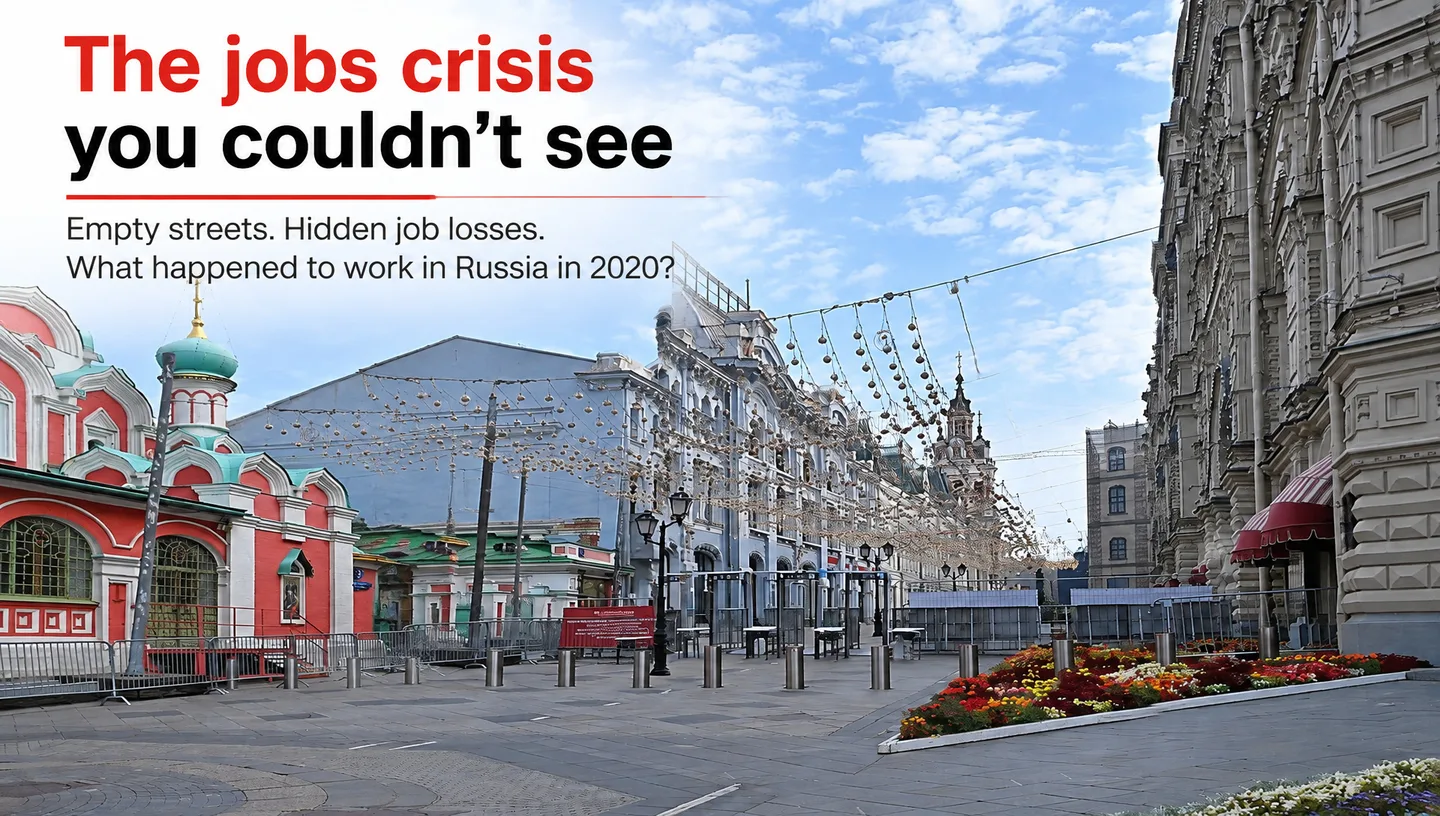
The jobs crisis you couldn’t see

What happened to work in Russia in 2020?
Готовая презентация

6 слайдов · PDF и PowerPoint

Бесплатно после входа.

Собрать свою презентацию по этой теме →

В этой презентации

Слайды и пояснения

Показать план

План презентации

  1. The jobs crisis you couldn’t see
  2. What we set out to find
  3. Our route
  4. A double shock
  5. The visible crisis
  6. The pain spread across sectors
1. The jobs crisis you couldn’t see

Empty streets. Hidden job losses. What happened to work in Russia in 2020?

Подсказка для выступления

Open with the empty-street image. Ask: “If city streets look empty, what might that mean for people’s jobs?”

2. What we set out to find

What we set out to find

Objective Trace how COVID-19 disrupted Russian employment—and why one headline number cannot tell the whole story.

Подсказка для выступления

Explain that this presentation focuses on the labor-market angle, rather than every economic effect. The goal is to connect the disruption to evidence and to distinguish measures that are often conflated.

3. Our route

Our route

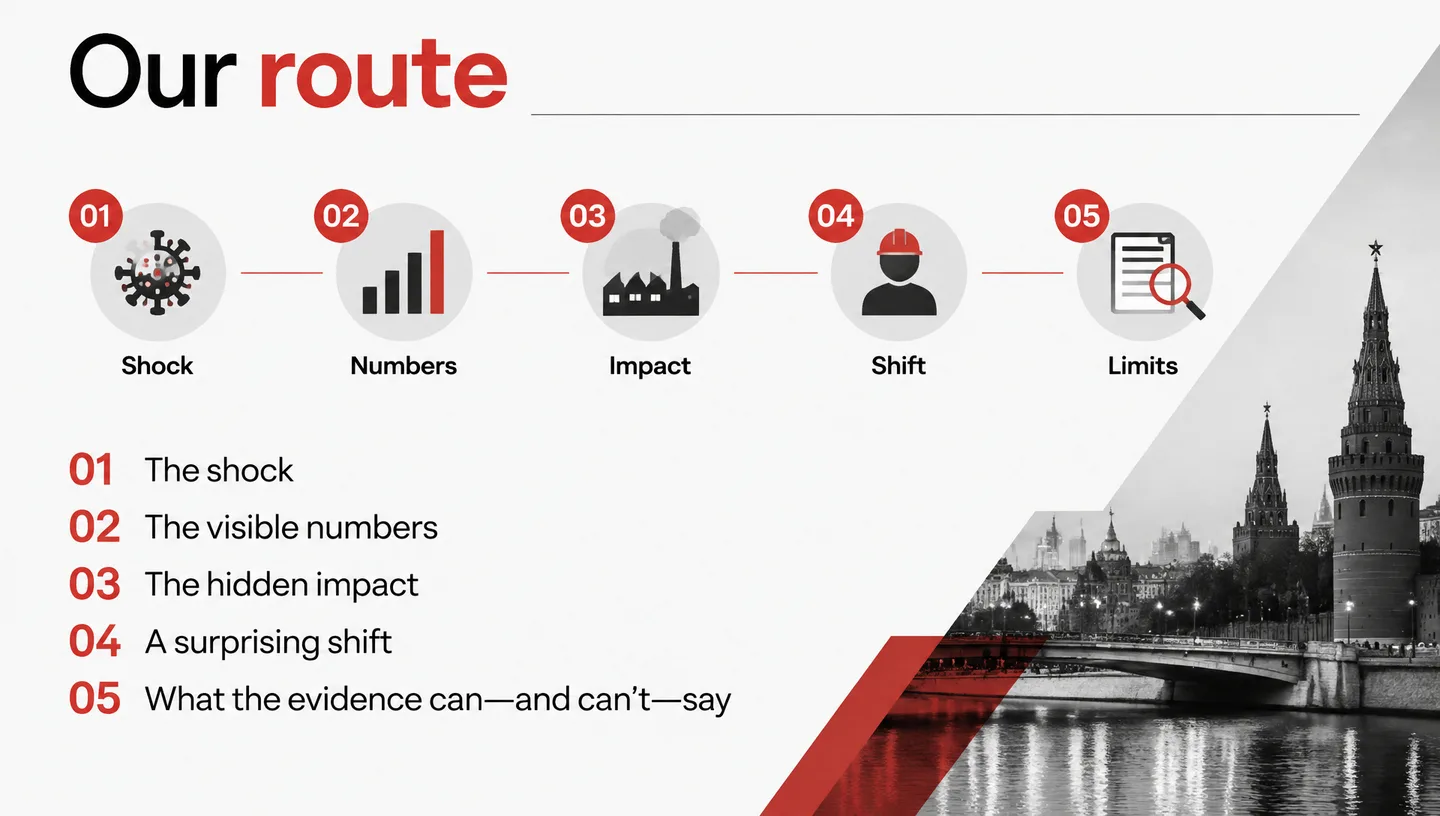
01 The shock 02 The visible numbers 03 The hidden impact 04 A surprising shift 05 What the evidence can—and can’t—say Shock — 01 Numbers — 02 Impact — 03 Shift — 04 Limits — 05

Подсказка для выступления

Preview the sequence: initial economic shock, headline indicators, which sectors and workers faced greater risks, the informal-employment finding, and limits of the data.

4. A double shock

A double shock

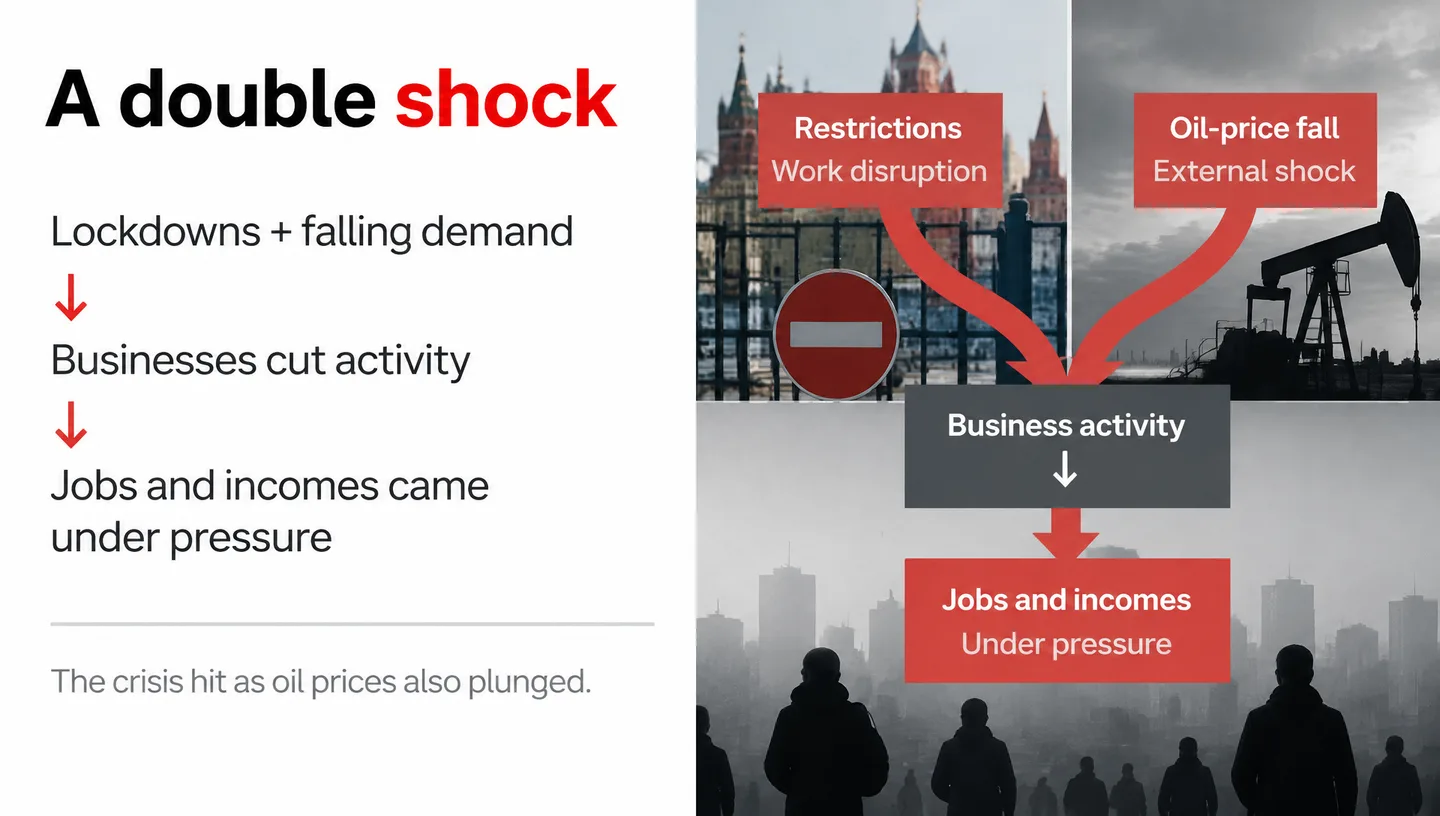
Lockdowns + falling demand ↓ Businesses cut activity ↓ Jobs and incomes came under pressure The crisis hit as oil prices also plunged. Restrictions — Work disruption Oil-price fall — External shock Business activity — ↓ Jobs and incomes — Under pressure

Подсказка для выступления

Explain that restrictions disrupted work operations and supply chains, while uncertainty and lower incomes weakened demand. Russia also faced a sharp decline in global oil prices. Avoid implying that COVID alone caused every economic change.

5. The visible crisis

The visible crisis

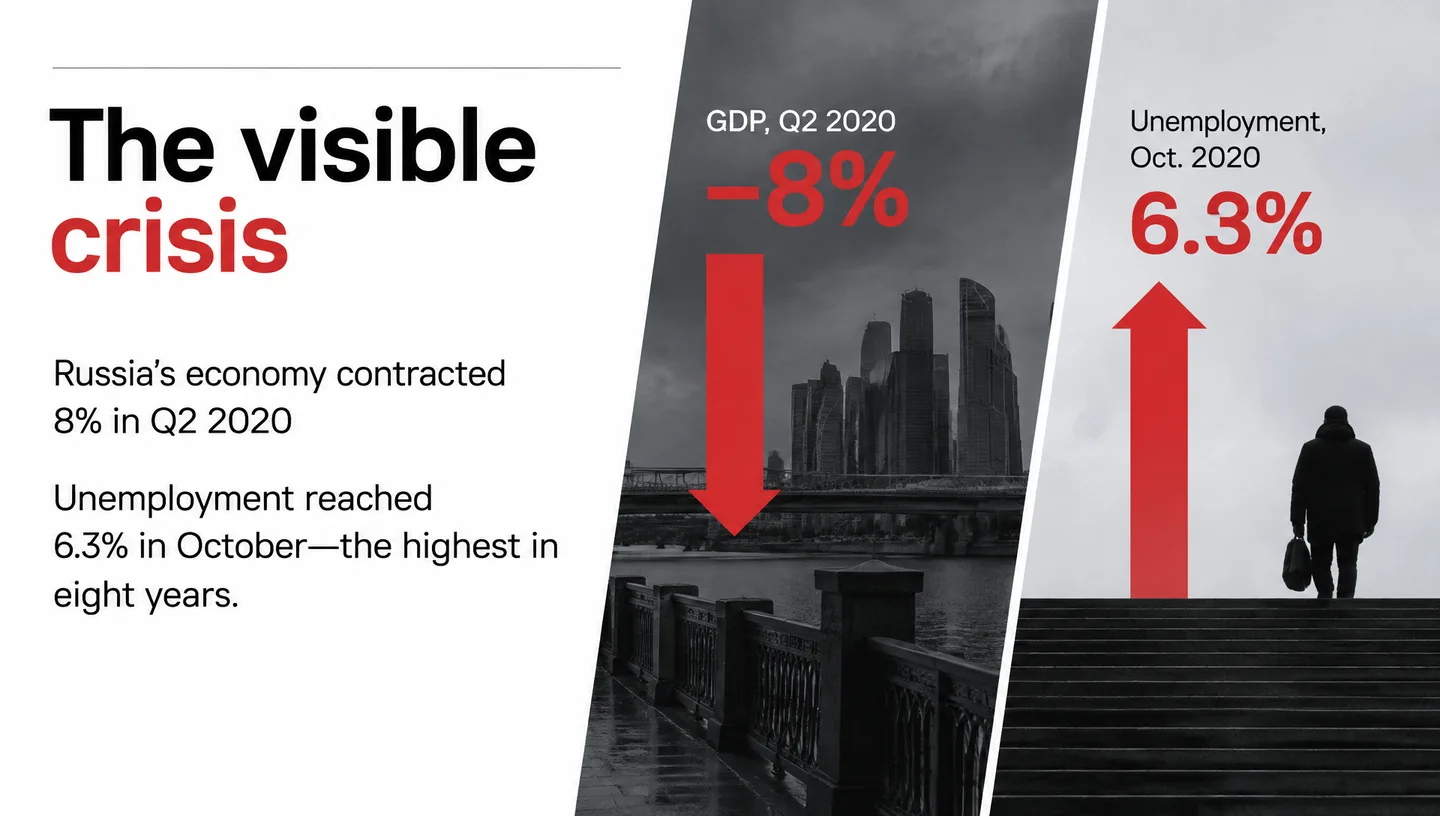
Russia’s economy contracted 8% in Q2 2020 Unemployment reached 6.3% in October—the highest in eight years. GDP, Q2 2020 — −8% Unemployment, Oct. 2020 — 6.3%

Подсказка для выступления

The World Bank reported an 8% contraction in Q2 and a 3.4% contraction in Q3 2020. It reported unemployment at 6.3% in October, the highest in eight years. Make clear that these figures describe different indicators and dates.

6. The pain spread across sectors

The pain spread across sectors

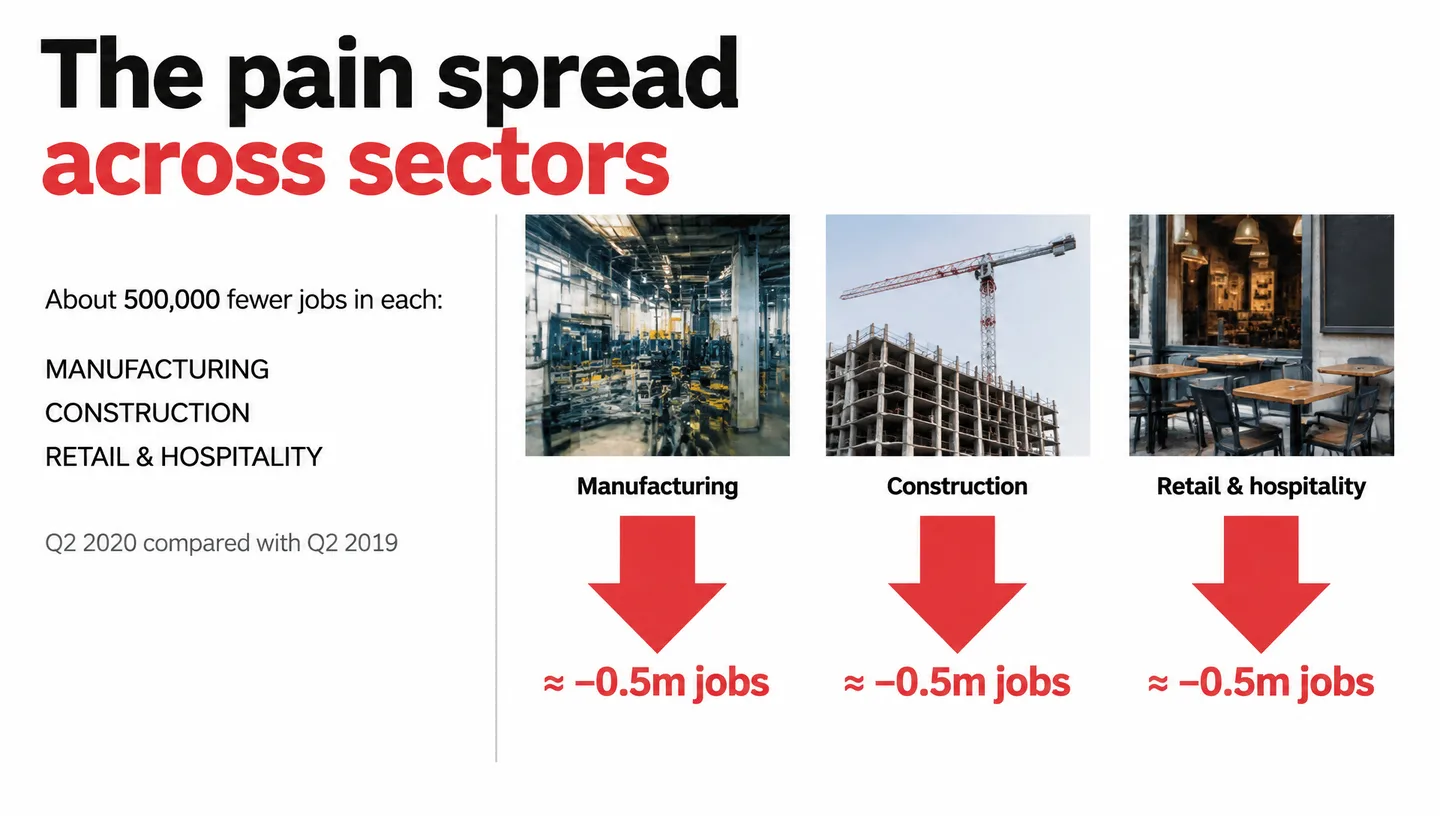
About 500,000 fewer jobs in each: MANUFACTURING CONSTRUCTION RETAIL & HOSPITALITY Q2 2020 compared with Q2 2019 Manufacturing — ≈ −0.5m jobs Construction — ≈ −0.5m jobs Retail & hospitality — ≈ −0.5m jobs

Подсказка для выступления

The World Bank reported approximately half a million jobs lost in each of manufacturing, construction, and retail and hospitality between Q2 2019 and Q2 2020. The wording is approximate; it does not mean exactly the same number of losses in every sector.

Источники